Average Miles Driven Per Year by State [Infographic]

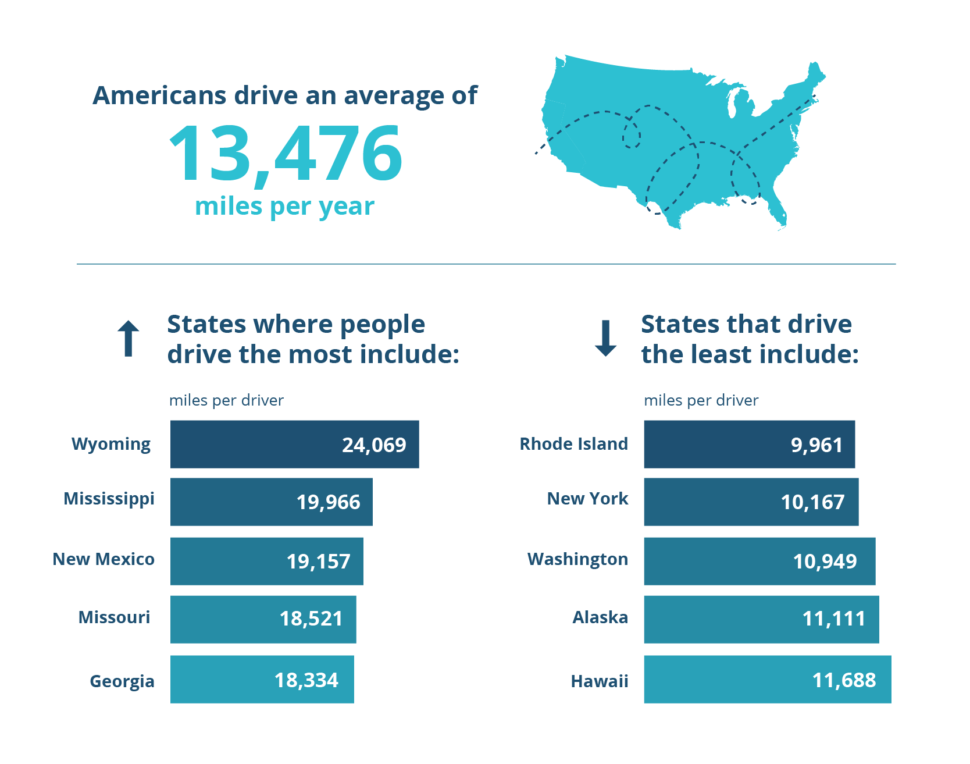
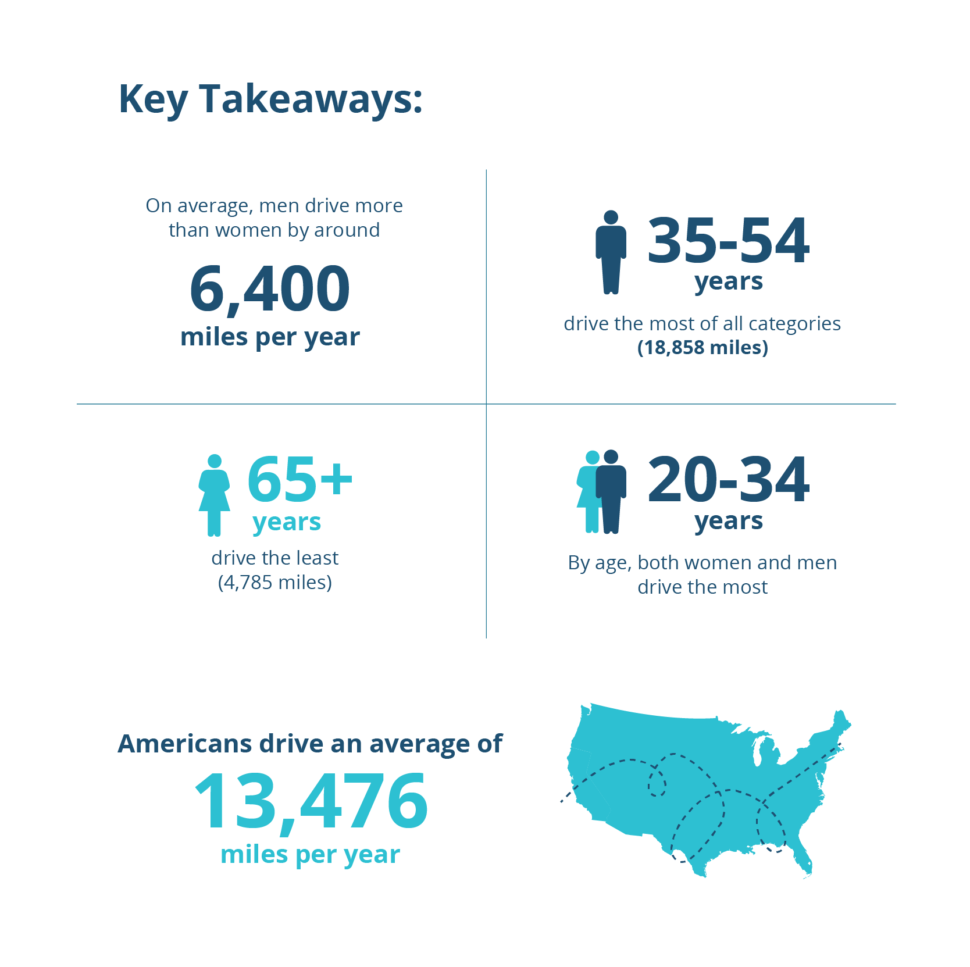
Looking for information about how many miles are driven each year? Americans drive an average of 13,476 miles per year. Check out our complete guide to the average miles driven per year in each state.

secured lock Secured with SHA-256 Encryption

By clicking, you agree to our Terms of Use

Nationwide State Farm Allstate
AllstateState FarmNationwideLiberty MutualFarmers Insurance

Find the Lowest Car Insurance Rates Today

Quote’s drivers have found rates as low as $42/month in the last few days!

Updated Mar 2024
Learn more about Liberty Mutual Insurance, what products they offer, what their consumers think about them and... more
Learn more about Liberty Mutual Insurance, what products they offer, what their consumers think about them and how they compare against other carriers. less
3.91
Average pricing $
Updated Nov 2024
Geico, short for Government Employees Insurance Company, is an American auto insurance company. It was founded... more
Geico, short for Government Employees Insurance Company, is an American auto insurance company. It was founded in 1936 and is currently headquartered in Chevy Chase, Maryland. Geico is known for its catchy advertising campaigns and its focus on providing affordable car insurance to a wide range of customers. The compan less
4.11
Average pricing $
Updated Mar 2025
For more than 90 years, American Family has been protecting and supporting its customers with strong customer ... more
For more than 90 years, American Family has been protecting and supporting its customers with strong customer service. They claim to be more than just an insurance company. They want to transform the way you think about insurance. At AmFam, they believe your dreams are important and that is why they work hard to protec less
4.01
Average pricing $
Updated Jan 2025
Learn more about USAA, what products they offer, what their consumers think about them and how they compare ag... more
Learn more about USAA, what products they offer, what their consumers think about them and how they compare against other carriers. less
4.68
Good pricing $$
Kalyn Johnson

Insurance Claims Support & Sr. Adjuster

Kalyn grew up in an insurance family with a grandfather, aunt, and uncle leading successful careers as insurance agents. She soon found she has similar interests and followed in their footsteps. After spending about ten years working in the insurance industry as both an appraiser dispatcher and a senior property claims adjuster, she decided to combine her years of insurance experience with another...

Written by
Kalyn Johnson
Michael Vereecke

Commercial Lines Coverage Specialist

Michael Vereecke is the president of Customers First Insurance Group. He has been a licensed insurance agent for over 13 years. He also carries a Commercial Lines Coverage Specialist (CLCS) Designation, providing him the expertise to spot holes in businesses’ coverage. Since 2009, he has worked with many insurance providers, giving him unique insight into the insurance market, differences in ...

Reviewed by
Michael Vereecke

Updated July 2024

What You Should Know

  • Americans drive an average of 13,476 miles per year
  • States with low population density drive the most
  • COVID-19 caused people to drive less than they normally would, impacting overall driving rates.

Due to the massive geographic scale and the urban sprawl of American cities, we have a higher average yearly mileage than anyone else. We drive an average of 13,476 miles per year, which is more than 30% more than our northern neighbors in Canada, who are second with 9,562.1  

But how many miles does the average person drive per year? 

How do these numbers break down by demographics? 

If you have any average annual mileage questions about daily miles that could be put on your new Toyota Prius for the car insurance company or what to expect before you sign your new car lease- you have come to the right place.  This infographic will answer all of your burning questions about the average miles driven per year to get the best auto insurance rate. 

Our Sourcing and a Note on COVID-19

For the most accurate information, the vast majority of sourcing in this document is pulled from the U.S. Department of Transportation’s Federal Highway Administration Highway Statistics Survey of 2019

This is the most recent year where a comprehensive study was completed and where driving habits were unaffected by the global pandemic. Naturally, COVID dramatically reduced the number of miles driven in the country.  Since the average American became a low mileage driver due to the stay-at-home order, we can expect high mileage for an average driver within the next few years. 

Going forward, all driving behavior trends point to the notion that once normal life resumes, the driving mileage will parallel (if not exceed) pre-COVID rates.  

Free Insurance Comparison

Compare Quotes From Top Companies and Save

secured lock Secured with SHA-256 Encryption

By clicking, you agree to our Terms of Use

Nationwide State Farm Allstate

What is the average car mileage per year per state? 

Americans drive more than any developed nation on earth, covering more than 3 trillion miles per year. But how much they drive depends on the state in which they live. Some states drive less in total on aggregate, but their citizens average more miles per driver.

Additionally, how much they spend on that car mileage varies greatly. For example, the average cost of fuel in California was $4.00, while the average in North Dakota was $2.78 per gallon.

State Average Miles Per Driver Total Miles Cost of Regular Fuel
Alabama 17,817 71 billion $2.63
Alaska 11,111 5.8 billion $3.17
Arizona 13,090 70 billion $3.05
Arkansas 17,224 37 billion $2.68
California 12,524 340 billion $4.00
Colorado 12,899 54 billion $2.96
Connecticut 12,117 31 billion $2.96
Delaware 12,609 10 billion $2.75
Florida 14,557 226 billion $2.79
Georgia 18,334 133 billion $2.70
Hawaii 11,688 11 billion $3.77
Idaho 14,417 18 billion $3.13
Illinois 12,581 107 billion $3.08
Indiana 18,024 82 billion $2.79
Iowa 14,745 33 billion $2.78
Kansas 14,781 31 billion $2.73
Kentucky 16,305 49 billion $2.73
Louisiana 14,951 51 billion $2.60
Maine 14,215 14 billion $2.83
Maryland 13,490 60 billion $2.81
Massachusetts 13,109 64 billion $2.77
Michigan 14,307 102 billion $2.82
Minnesota 17,909 60 billion $2.73
Mississippi 19,966 41 billion $2.57
Missouri 18,521 79 billion $2.66
Montana 15,880 12 billion $2.81
Nebraska 14,846 21 billion $2.81
Nevada 14,016 28 billion $3.46
New Hampshire 11,570 13 billion $2.73
New Jersey 12,263 78 billion $2.92
New Mexico 19,157 27 billion $2.86
New York 10,167 123 billion $2.92
North Carolina 16,073 122 billion $2.63
North Dakota 17,671 9 billion $2.78
Ohio 14,278 114 billion $2.81
Oklahoma 17,699 44 billion $2.66
Oregon 12,218 35 billion $3.25
Pennsylvania 11,445 102 billion $3.00
Rhode Island 9,961 7 billion $2.81
South Carolina 14,941 57 billion $2.59
South Dakota 15,541 9 billion $2.85
Tennessee 15,287 82 billion $2.69
Texas 16,172 288 billion $2.58
Utah 15,516 32 billion $3.17
Vermont 13,004 7 billion $2.81
Virginia 14,509 85 billion $2.70
Washington 10,949 62 billion $3.42
West Virginia 16,876 19 billion $2.78
Wisconsin 15,442 66 billion $2.73
Wyoming 24,069 10 billion $2.93

States with the Most Driving

Although it’s not always the case, generally speaking, the more sparsely populated a state is, the longer and more frequently a person will need to drive. 

States where people drive the most include: 

  1. Wyoming – 24,069 miles per driver
  2. Mississippi – 19,966  miles per driver
  3. New Mexico – 19,157 miles per driver
  4. Missouri – 18,521  miles per driver
  5. Georgia – 18,334  miles per driver

These states have a relatively low population density and could be considered rural. States like Wyoming and New Mexico rank amongst the least population-dense states.   

AUTO Infographic Average Miles

States With the Least Driving

Looking to live in a state where low mileage car insurance is the norm? Naturally factors like fuel prices, state geography, and population density impact mileage rates. For instance, many of the largest urban northeastern states along the Acela corridor don’t need to drive as much due to tighter geographic proximity and less urban sprawl. This makes it easier to have and use a public transit system, which reduces the need to drive.  

States that drive the least include: 

  1. Rhode Island – 9,961 
  2. New York – 10,167
  3. Washington – 10,949
  4. Alaska – 11,111
  5. Hawaii – 11,688

Looking at these regions, it’s easy to speculate why rates are lower. In places like New York, many citizens in NYC don’t need cars since they live in a large, walkable city with efficient public transit systems. Additionally, in places like Rhode Island and Hawaii, there’s not a lot of space to drive. 

Free Insurance Comparison

Compare Quotes From Top Companies and Save

secured lock Secured with SHA-256 Encryption

By clicking, you agree to our Terms of Use

Nationwide State Farm Allstate

Driving By Demographics 

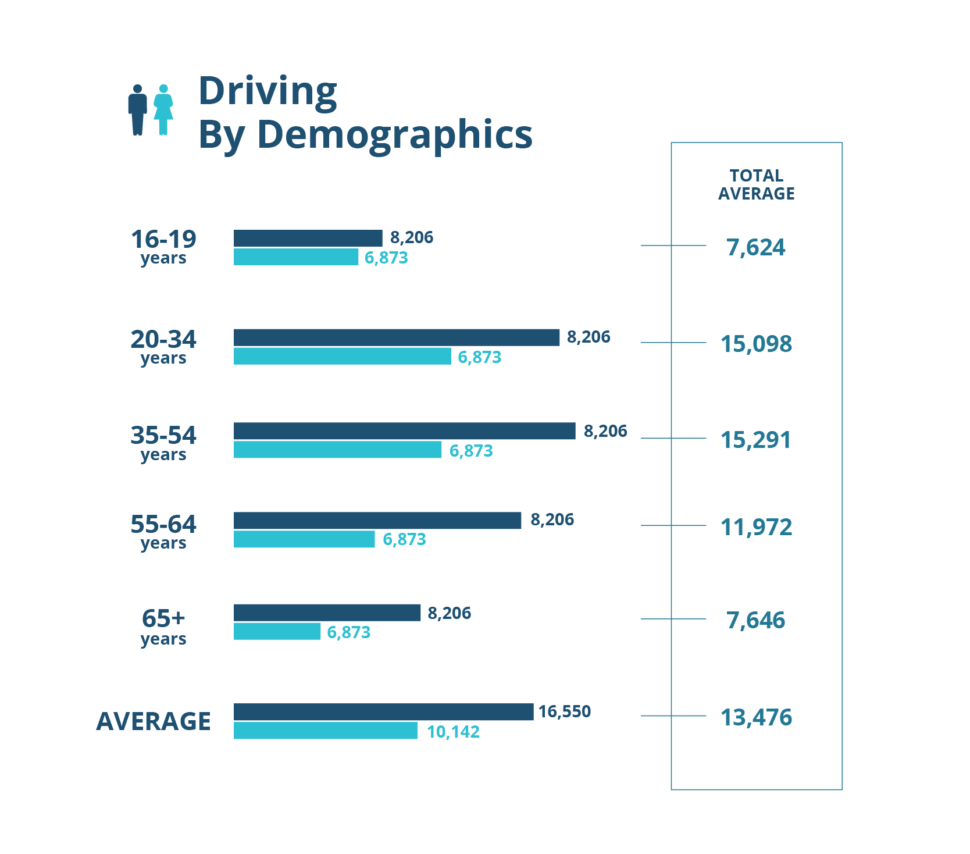
Men and women don’t have the same driving behavior. Additionally, age also impacts how much a person tends to drive. Broken down by age and sex demographics, the average miles driven per American looks like:

Age Male Female Total Average
16-19 8,206 6,873 7,624
20-34 17,976 12,004 15,098
35-54 18,858 11,464 15,291
55-64 15,859 7,780 11,972
65+ 10,304 4,785 7,646
Average 16,550 10,142 13,476
AUTO Infographic Average Miles

COVID’s Impact on Driving Rates 

COVID has caused people to drive less frequently than they would in a normal year. Lockdowns and work-from-home orders reduced the frequency of necessary driving as well as vacation driving. 

For instance, even in the summer months when lockdowns lax in many states, you can see significant differences across all regions when comparing July 2020 traffic volumes2 with July 2019 volumes:3 

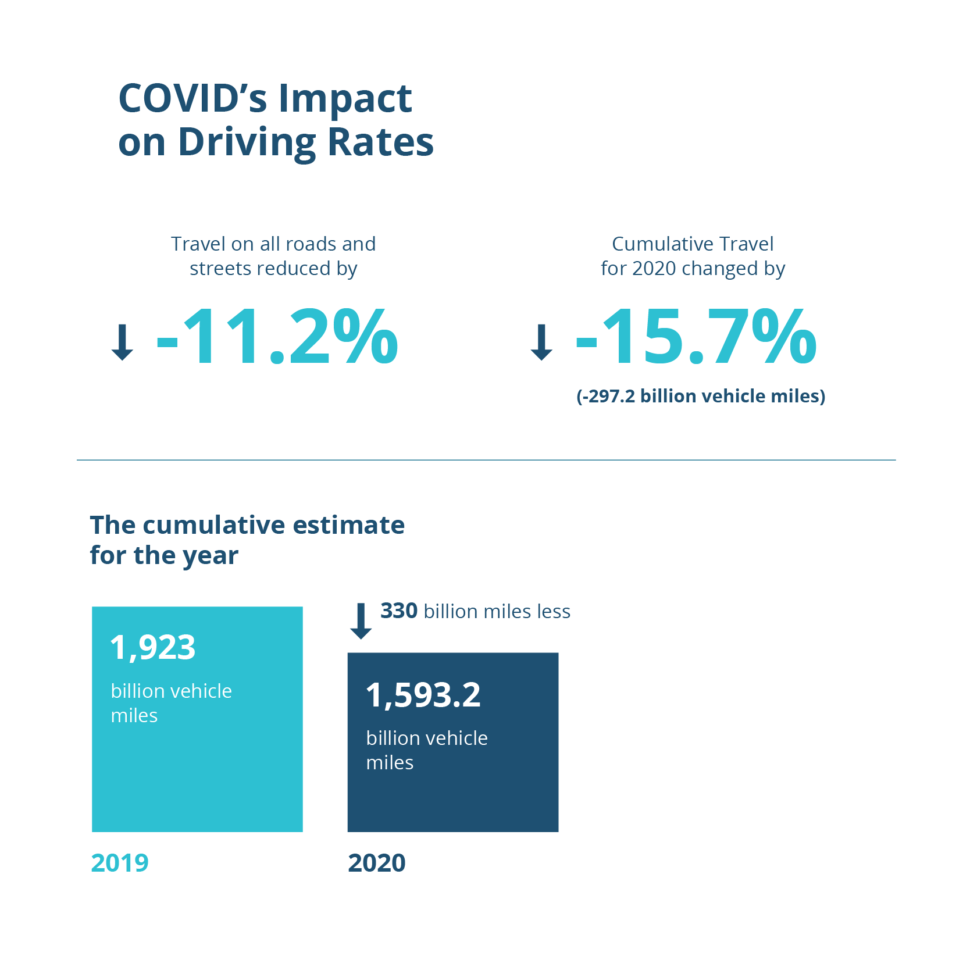
  • Travel on all roads and streets was reduced by -11.2% 
  • Cumulative Travel for 2020 changed by -15.7% (-297.2 billion vehicle miles)
  • The cumulative estimate for the year is 1,593.2 billion vehicle miles of travel, nearly 330 billion miles less than in 2019.
AUTO Infographic Average Miles

By region: 

Region Total travel in billions of miles Percentage change
North-East 34.9 -15.4
South-Atlantic 57 -11.3
North-Central 60.0 -9.7
South-Gulf 52.7 -10.8
West 57.8 -10.4

Additionally, the decrease in traffic caused by emptier roads resulted in a higher frequency of reckless driving, despite the decreased number of car accidents. According to an accident study focused on California:4 

  • Accident rates across California saw accident reductions as significant as 75%
  • Auto accidents caused by speeding had been cut in half 
  • California Highway Patrol (CHP) saw a 46% increase in tickets issued for drivers speeding at or above 100mph

The fewer cars there were on the road, the more opportunities there were to speed. That said, with states opening up, 2021 will likely have numbers that are closer to 2019 than 2020. 

Understanding the Impact of Driving Habits on Car Longevity

Driving habits play a crucial role in the longevity and maintenance of your vehicle. In this topic, we’ll explore how the average amount of miles driven in a year can affect your car’s performance, maintenance needs, and overall lifespan.

Factors Influencing the Average Miles-Driven

Several factors contribute to the average amount of miles driven per year. Understanding these can help you better estimate your driving habits and the expected wear and tear on your vehicle.

Daily Commute

  • Work Commute: The distance you travel to and from work significantly impacts the average amount of miles on a car per year.
  • Errands and Leisure: Additional trips for errands and leisure activities add to the average amount of miles per year on your car.

Geographic Location

  • Urban vs. Rural: Living in urban areas typically results in lower mileage due to shorter distances and available public transport. Conversely, rural areas often have higher average car mileage per year due to longer travel distances.

Lifestyle and Travel

  • Road Trips: Frequent long-distance travel for vacations or business trips increases the average car mileage in a year.
  • Family Activities: Families with multiple children involved in activities can also see a higher average car miles per year.

Analyzing Average Car Mileage Statistics

Let’s delve into some statistics to understand how different factors impact the average driver miles per year.

National Averages

  • The average mileage in a year for an American driver is approximately 13,476 miles.
  • In Texas, the average mileage per year can be higher due to the state’s vast size and longer travel distances, with figures around 16,000 miles.

State-Specific Data

  • Average Miles Driven Per Year in California: California sees a lower average compared to Texas, primarily due to heavy traffic and urban density, averaging around 12,524 miles.
  • Average Miles Driven Per Year in Texas: Texas drivers tend to have higher mileage, often reaching around 16,000 miles per year.

Vehicle Type Differences

  • Average Miles Per Year on a Truck: Trucks are often used for longer distances and heavier loads, resulting in an average of 15,000 miles per year.
  • Average Miles Per Year on an SUV: SUVs also see higher mileage, averaging about 14,000 miles per year.

Monthly and Yearly Mileage Breakdown

Understanding your average mileage per month can help in planning maintenance and budgeting for fuel and other expenses.

Monthly Averages

  • Average Miles Per Month on a Car: This varies based on usage patterns but follows the general monthly average miles per month.

Yearly Averages

  • Average Yearly Mileage on a Car: Consistently tracking your yearly mileage can help in maintaining your vehicle’s health and scheduling timely services. Average mileage per year for a car can aid in this process.

Impact on Insurance and Vehicle Longevity

Higher mileage affects both insurance rates and the longevity of your vehicle. Here’s how:

Insurance Considerations

  • Mileage Impact on Premiums: Higher average miles driven per year often result in higher insurance premiums due to increased risk of accidents and wear and tear.

Vehicle Maintenance and Resale

  • Maintenance Needs: Vehicles with high average miles per year require more frequent maintenance, such as oil changes, tire rotations, and brake checks.
  • Resale Value: High average yearly vehicle mileage can reduce the resale value of your car, as buyers often prefer low-mileage vehicles.

Understanding your driving habits and their impact on your vehicle can help you make informed decisions about maintenance, insurance, and overall vehicle care.

Monitoring the average amount of miles driven in a year and adjusting your habits can contribute to the longevity and performance of your car, ensuring it remains reliable for years to come.

Understanding Average Yearly Mileage Trends

H3: Analyzing Average Miles Put on a Car in a Year

When considering the average miles put on a vehicle per year, it’s essential to examine the broader trends and patterns in vehicle usage. Several key factors influence the average yearly mileage on cars:

  1. Driving Habits: Individuals with longer commutes, frequent road trips, or professions that require extensive travel may accumulate higher average yearly mileage on their vehicles.

  2. Geographic Location: The average yearly mileage on a car can vary significantly based on geographic location. Urban areas with congested traffic and limited public transportation may result in lower average yearly mileage, while rural areas with longer distances between destinations may lead to higher mileage.

  3. Vehicle Type: Different types of vehicles, such as sedans, SUVs, and trucks, may have varying average yearly mileage patterns. Factors such as fuel efficiency, vehicle size, and intended use can influence how many miles per year a car typically accrues.

  4. Lifestyle Factors: Individual lifestyle choices, such as recreational activities, commuting preferences, and family obligations, can impact the average yearly mileage on a vehicle. Active lifestyles that involve frequent travel or outdoor pursuits may result in higher mileage compared to more sedentary lifestyles.

H3: Examining Normal Miles Per Year on Vehicles

Understanding what constitutes normal miles per year on vehicles can provide valuable benchmarks for vehicle owners and industry professionals. While the definition of “normal” mileage can vary based on individual circumstances and vehicle usage, certain trends can help gauge typical mileage patterns:

  1. National Averages: National averages for yearly vehicle mileage provide a baseline for assessing normal miles per year. Tracking these averages over time can reveal shifts in driving habits and societal trends.

  2. Vehicle Age: The age of a vehicle can influence its average car mileage per year. Newer vehicles may accrue higher mileage in their early years due to frequent use, while older vehicles may experience lower yearly mileage as they age and usage patterns change.

  3. Usage Patterns: Analyzing usage patterns, such as daily commuting distance, frequency of long-distance travel, and vehicle sharing arrangements, can help determine normal average miles per year for specific vehicles and drivers.

  4. Environmental Factors: Environmental considerations, such as fuel prices, infrastructure development, and climate change initiatives, can impact normal miles per year by influencing driving behavior and vehicle choices.

H3: Implications of Yearly Average Mileage on Cars

Understanding the implications of yearly average mileage on cars is crucial for various stakeholders, including vehicle owners, insurers, and policymakers. Some key implications include:

  1. Vehicle Maintenance: Higher average yearly mileage may necessitate more frequent maintenance and repairs to ensure the continued reliability and safety of vehicles.

  2. Insurance Premiums: Average yearly mileage is a significant factor in determining insurance premiums, with higher mileage often associated with increased risk of accidents and claims.

  3. Environmental Impact: Yearly average mileage on cars contributes to greenhouse gas emissions and air pollution, highlighting the importance of promoting sustainable transportation practices and reducing vehicle miles traveled.

  4. Resale Value: Average yearly mileage can influence the resale value of vehicles, with lower mileage often correlating with higher resale prices and increased market demand.

By examining average yearly mileage trends and understanding their implications, stakeholders can make informed decisions regarding vehicle ownership, usage, and policy development to promote safer, more sustainable transportation systems.

Free Insurance Comparison

Compare Quotes From Top Companies and Save

secured lock Secured with SHA-256 Encryption

By clicking, you agree to our Terms of Use

Nationwide State Farm Allstate

Exploring Average Vehicle Mileage Trends

Understanding how much a car is driven annually is essential for various aspects of vehicle ownership and maintenance. The average car miles in a year can reveal significant insights into a vehicle’s condition and expected lifespan.

By examining the average mileage driven in a year, car owners can better plan for maintenance schedules and predict potential wear and tear. This exploration of average mileage driven per year helps in comprehending overall vehicle usage patterns and their impact on a car’s performance and value.

  • Average Car Mileage Per Year: The average amount of miles per year on a car serves as a key metric in understanding vehicle usage patterns and overall wear and tear.
  • Average Car Mileage Per Month: Breaking down the average car mileage into monthly figures helps in analyzing driving habits and planning maintenance schedules.
  • Average Yearly Car Mileage: Examining the average yearly car mileage provides insights into long-term vehicle usage trends and potential impacts on resale value.

Regional Variations

When analyzing driving patterns, understanding the average mileage on a car per year and the average mileage per year on a truck can provide valuable insights. These metrics not only highlight individual driving habits but also reflect broader trends in transportation and fuel consumption.

By examining the average miles a car is driven per year, we can better appreciate regional variations and the factors that influence these patterns.

  • Average Mileage Per Year in Texas: Texas, being a large state with diverse landscapes and transportation needs, may exhibit unique average mileage per year trends compared to other regions.
  • National Average Miles Per Year: Understanding the national average miles per year provides a broader perspective on driving habits and fuel consumption across the country.
  • Regional Differences: Factors such as urban density, infrastructure, and lifestyle contribute to variations in average yearly mileage, both within states like Texas and across the nation.

Vehicle-Specific Considerations

Understanding the average miles driven in a year is crucial for vehicle owners, fleet managers, and prospective buyers. Knowing the average miles in a year and breaking it down to the average miles driven per month can provide insights into vehicle reliability, maintenance needs, and operational costs.

This data is essential for making informed decisions about vehicle purchases, upkeep, and overall management.

  • Average Miles Per Year on a Truck: Trucks, often used for commercial purposes or heavy-duty tasks, may accumulate higher average yearly mileage compared to passenger cars.
  • Average Miles Per Year on a Car: Analyzing the average miles per year on a car helps in assessing vehicle reliability, maintenance costs, and potential future expenses.

Considering the average miles per year for a vehicle as a whole offers insights into fleet management, depreciation, and operational costs.

Understanding these averages can lead to better decision-making and more efficient vehicle management. Make informed choices to ensure the longevity and reliability of your vehicles.

Environmental and Economic Impact

Understanding the average miles driven per year on a car is key to evaluating its usage patterns and overall impact.

Whether considering the average miles driven per year per car, this data plays a crucial role in various aspects, from fuel consumption and insurance premiums to long-term planning for vehicle maintenance and budgeting. 

  • Impact on Fuel Consumption: Understanding typical mileage per year aids in estimating fuel consumption rates, contributing to discussions on energy efficiency and sustainability.
  • Insurance Considerations: Car insurance premiums may be influenced by average yearly mileage, with higher mileage vehicles often associated with increased risk and potential claims.
  • Long-Term Planning: By examining typical mileage per year, individuals and organizations can make informed decisions regarding vehicle purchases, maintenance schedules, and budgeting for future expenses.

Average yearly mileage on cars and trucks serves as a crucial metric in understanding driving habits, vehicle performance, and environmental impact. Knowing the average miles on a car per year can help us make informed decisions about vehicle maintenance, fuel consumption, and overall efficiency.

By analyzing regional variations and considering vehicle-specific factors, stakeholders can make informed decisions to optimize efficiency, reduce costs, and promote sustainable transportation practices.

Average Miles Driven per Year on a Vehicle

When considering the average miles per year for a car or vehicle, several factors come into play. Here’s a breakdown of what to consider:

  • Calculation Method: Determine the average miles put on a car per year using reliable data sources. Calculate the average yearly mileage for a car based on driving habits and usage patterns.
  • Variations by Vehicle Type: Compare the average miles per year on a car to that of other vehicle types like trucks or SUVs. Analyze how driving habits influence the average yearly mileage for cars of different makes and models.
  • Geographic and Demographic Factors: Explore how location and demographics impact normal mileage per year. Consider variations in typical miles driven per year based on urban, suburban, or rural settings.
  • Impact on Insurance and Maintenance: Discuss how average yearly miles driven affect car insurance premiums. Explain the correlation between normal yearly car mileage and vehicle maintenance needs.
  • Trends and Industry Insights: Provide insights into trends in average yearly mileage on cars over the years. Highlight industry standards and benchmarks for average miles per year on your car.
  • Future Projections and Sustainability: Predictions on how technological advancements and changing lifestyles may impact average yearly mileage for cars. Considerations for promoting sustainable driving practices amidst varying average yearly miles driven trends.

By examining these aspects, we can gain a comprehensive understanding of the average miles per year on a vehicle and its implications for drivers, insurers, and the automotive industry as a whole.

Car Mileage and Car Purchases

If you drive a lot, it’s important to have a reliable car with low-cost car repairs and excellent gas mileage. The impact gas alone can have on your wallet is immense. 

Consider a male driver who’s 36 and living in Wyoming:

  • In 2019, on average, he drove 24,000 miles per year at $2.93 per gallon. 
  • If he drove a car that got 20 miles per gallon, he could expect to pay $3,516 in gas. 
  • However, if his car got 40 miles per gallon, he could pay half that, $1,758 in gas.  
  • Taken year over year for five years, the cost-savings between the two cars could amount to $8,790 in gas costs alone.

Not to mention, if you drive less, you can likely save money on your car insurance. If you’re someone who plans on having a high driving mileage, it’s critical to consider your car’s gas mileage.

Understanding your driving habits and their financial implications can help you make more informed decisions. Whether it’s choosing a fuel-efficient vehicle or managing miles per year average, every decision impacts your budget. Keep in mind your miles per year car to optimize costs and savings.

If you would like to compare quotes from other companies, enter your ZIP code into our free tool.

Free Insurance Comparison

Compare Quotes From Top Companies and Save

secured lock Secured with SHA-256 Encryption

By clicking, you agree to our Terms of Use

Nationwide State Farm Allstate

All Your Car Insurance Needs Covered—4AutoInsuranceQuote 

Whether you’re looking to compare auto insurance rates or simply educating yourself on all things car insurance-related—you’re in the right place.

4AutoInsurance provides the tools and resources you need to make intelligent decisions regarding your policy. Want to compare quotes from the top insurance agencies in the country? You can do so for free with us. Need more information before you make a decision? Check out more of our resources.

For all your auto insurance needs—4AutoInsurance can help.

Frequently Asked Questions

How many miles does the average person drive per year?

On average, Americans drive 13,476 miles per year, which is more than any other developed nation.

How do the average miles driven per year break down by demographics?

Driving behavior varies based on demographics. Men tend to drive more than women, and age also impacts driving habits. Younger individuals generally drive more than older individuals.

Which states have the highest and lowest average car mileage per year?

States with low population density, such as Wyoming and New Mexico, have higher average car mileage per year. On the other hand, states with denser urban areas like New York and Rhode Island tend to have lower average car mileage per year.

How did COVID-19 impact driving rates?

Due to lockdowns and work-from-home orders, people drove less frequently during the pandemic. However, as restrictions ease, driving rates are expected to return to pre-COVID levels.

How does car mileage affect car insurance rates?

Car mileage can impact car insurance rates. If you drive a lot, it’s important to have a reliable car with good gas mileage and low-cost repairs. Additionally, driving less can often lead to lower car insurance premiums.

How many miles do Americans drive a year?

On average, Americans drive 13,476 miles per year.

Get a FREE Quote in Minutes

Insurance rates change constantly — we help you stay ahead by making it easy to compare top options and save.

secured lock Secured with SHA-256 Encryption

By clicking, you agree to our Terms of Use

Nationwide State Farm Allstate
Liberty MutualFarmers InsuranceNationwideAllstate